|
Summary
|
|
|
|
|
|
Fund Name
|
Nippon India Mutual Fund
|
|
Scheme Name
|
Nippon India ETF Nifty Next 50 Junior BeES
|
|
AMC
|
Nippon Life India Asset Management Limited
|
|
Type
|
Open ended scheme
|
|
Category
|
ETFs - Index
|
|
Launch Date |
21-Feb-03
|
|
Fund Manager
|
Himanshu Mange
|
|
Face Value
|
10
|
|
Custodian |
Deutsche Bank A.G.
|
|
Net Assets (Rs. cr)
|
7811.98
|
|
|
|
|
|
|
|
|
|
|
|
NAV Details
|
|
|
|
NAV Date
|
08-Jun-26 |
Max Entry Load %
|
0.00 |
|
NAV [Rs] |
743.68 |
Max Exit Load %
|
0.00 |
|
Buy/Resale Price [Rs]
|
743.68 |
52 Week High[Rs] |
775.80 (27-May-26) |
|
Sell/Repurchase Price [Rs]
|
743.68 |
52 Week Low[Rs]
|
650.36 (31-Mar-26) |
|
|
|
NAV Graph |
|
|
|
|
|
|
|
|
|
|
|
|
|
|
|
Dividend Details
|
|
Record
|
Record
|
Dividend Per Unit (Rs.)
|
Bonus |
Ex.Div |
Ex.Div
|
|
Date
|
NAV(Rs)
|
Indivisual/HUF |
Others
|
Ratio |
Date |
NAV(Rs) |
|
10-Mar-2014
|
128.6304
|
1
|
1
|
-
|
11-Mar-2014
|
126.5231
|
|
09-Jul-2009
|
74.1272
|
1.25
|
1.25
|
-
|
09-Jul-2009
|
74.1272
|
|
|
|
|
|
|
|
|
Investment Details
|
|
Objective |
| The investment objective of Nippon India ETF Junior BeES is to provide returns that, before expenses, closely correspond to the returns of Securities as represented by Nifty Next 50 Index. |
|
|
|
Min. Investment (Rs.)
|
10000 |
|
Increm.Investment (Rs.)
|
1000 |
|
|
|
Investment Pattern |
| Type | Minimum % | Maximum % | | Securities covered by Nifty Next 50 Index | 95 | 100 | | MMI (with maturity not exceeding 91D), including CBLO, cash & cash equiv | 0 | 5 |
|
|
|
|
SIP Details |
|
|
SIP MIN Investments(Rs.) |
NA |
|
SIP Incremental Investments(Rs.) |
NA |
|
SIP Frequency |
NA |
|
No.of Investments Cheques
|
NA |
|
|
|
|
|
|
|
|
Ratios
|
|
Statistical Ratios |
|
|
|
Beta [%] |
1.0828
|
|
Sharpe Ratio [%] |
-0.0082
|
|
R-Square [%] |
0.8530
|
|
Expense Ratio [%] |
0.1800
|
|
AVG Ratio [%] |
-0.0420
|
|
|
|
|
|
Other Ratios |
|
|
|
Treynor Ratio [%] |
-0.0016
|
|
Turnover Ratio [%] |
0.3000
|
|
FAMA Ratio [%] |
0.0462
|
|
SORTINO Ratio [%] |
-0.1115
|
|
|
|
|

|
What is Standard Deviation?
Standard Deviation is the measure of the deviation in the returns of the portfolio. In Simple Words it tells us how much the return on the fund is deviating from the expected normal return.
|
|
|
What is Jenson's Alpha?
It measures whether the Scheme is generating excess returns over the normal returns.For example, if there are two mutual funds that both have a 12% return, a rational investor will want the fund that is less risky.If the value is positive, then the portfolio is earning excess returns. In other words, a positive value for Jensen's alpha means a fund manager has 'beat the market' w with his or her stock picking skills. The Higher the value the better the performance.
|
|
|
|
|
|
|
Portfolio Analysis
|
|
Allocations As on
30-Apr-2026
|
|
|
|
Fund Size :
7811.98
(Cr.) |
|
|
|
 |
|
 |
|
Market cap-wise Allocation Style |
|
|
|
Average Mkt Cap (Rs Cr) |
147062.41
|
|
Market Capitalization |
% of Portfolio
|
|
Large |
96.62
|
|
Mid |
NA
|
|
Small |
NA
|
|
Note: Large-Cap = 5000 Crs. and above, Mid-Cap = 2000 Crs. to 5000 Crs. and
Small-Cap = less than 2000 Crs. |
|
|
|
|
|
|
Portfolio Concentration |
|
|
% Net Assets
|
|
Top 3 Sectors |
42.07 |
|
|
|
+ - Top 5 Holdings |
17.19 |
| Adani Power | 3.72 | | Tata Motors | 3.47 | | Divi's Lab | 3.35 | | Hindustan Aeron | 3.34 | | TVS Motor | 3.32 |
|
|
+ - Top 10 Holdings |
31.41 |
| Adani Power | 3.72 | | Tata Motors | 3.47 | | Divi's Lab | 3.35 | | Hindustan Aeron | 3.34 | | TVS Motor | 3.32 | | Tata Power | 3.02 | | Cummins India | 2.88 | | Varun Beverages | 2.85 | | Avenue Supermarts | 2.74 | | Britannia Inds | 2.73 |
|
|
|
|
|
 Adani Power Ltd.
|
3.72
|
 Tata Motors Ltd.
|
3.47
|
|
Divi's Laboratories Ltd.
|
3.35
|
|
Hindustan Aeronautics Ltd.
|
3.34
|
|
TVS Motor Company Ltd.
|
3.32
|
|
Tata Power Company Ltd.
|
3.02
|
|
Cummins India Ltd.
|
2.88
|
|
Varun Beverages Ltd.
|
2.85
|
|
Avenue Supermarts Ltd.
|
2.74
|
|
Britannia Industries Ltd.
|
2.73
|
|
|
 Indicates an increase
or decrease or no change in holding since last portfolio Indicates an increase
or decrease or no change in holding since last portfolio
|
 Indicates a new
holding since last portfolio. Indicates a new
holding since last portfolio.
|
|
|
Detailed Portfolio |
|
|
|
|
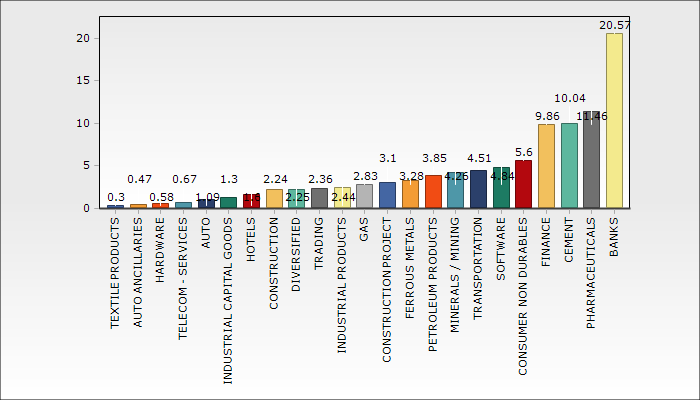
Sector Allocation * (as % of equity portfolio) |
|
|
|
Sector Allocation
Chart Type : |
 |
|
*Pertains to the equity investments only. |
|
|
|
|
|
|
|
|
|
|
What's In / What's Out
|
| What's in as on 30-Apr-2026 |
What's out as on 30-Apr-2026 |
| Company Name | Mkt Value | Holdings | | (Rs.Cr) | % | | MALCO Energy Ltd. | 20.3365 | 0.2603 | | Talwandi Sabo Power Ltd. | 20.7691 | 0.2659 | | Vedanta Aluminium Metal Ltd. | 205.9605 | 2.6365 | | Vedanta Iron And Steel Ltd. | 12.9807 | 0.1662 |
|
| Company Name | Mkt Value | Holdings | | (Rs.Cr) | % |
|
|
|
|
|
|
|
|

